


|
Getting your Trinity Audio player ready...
|
July 29, 2026.
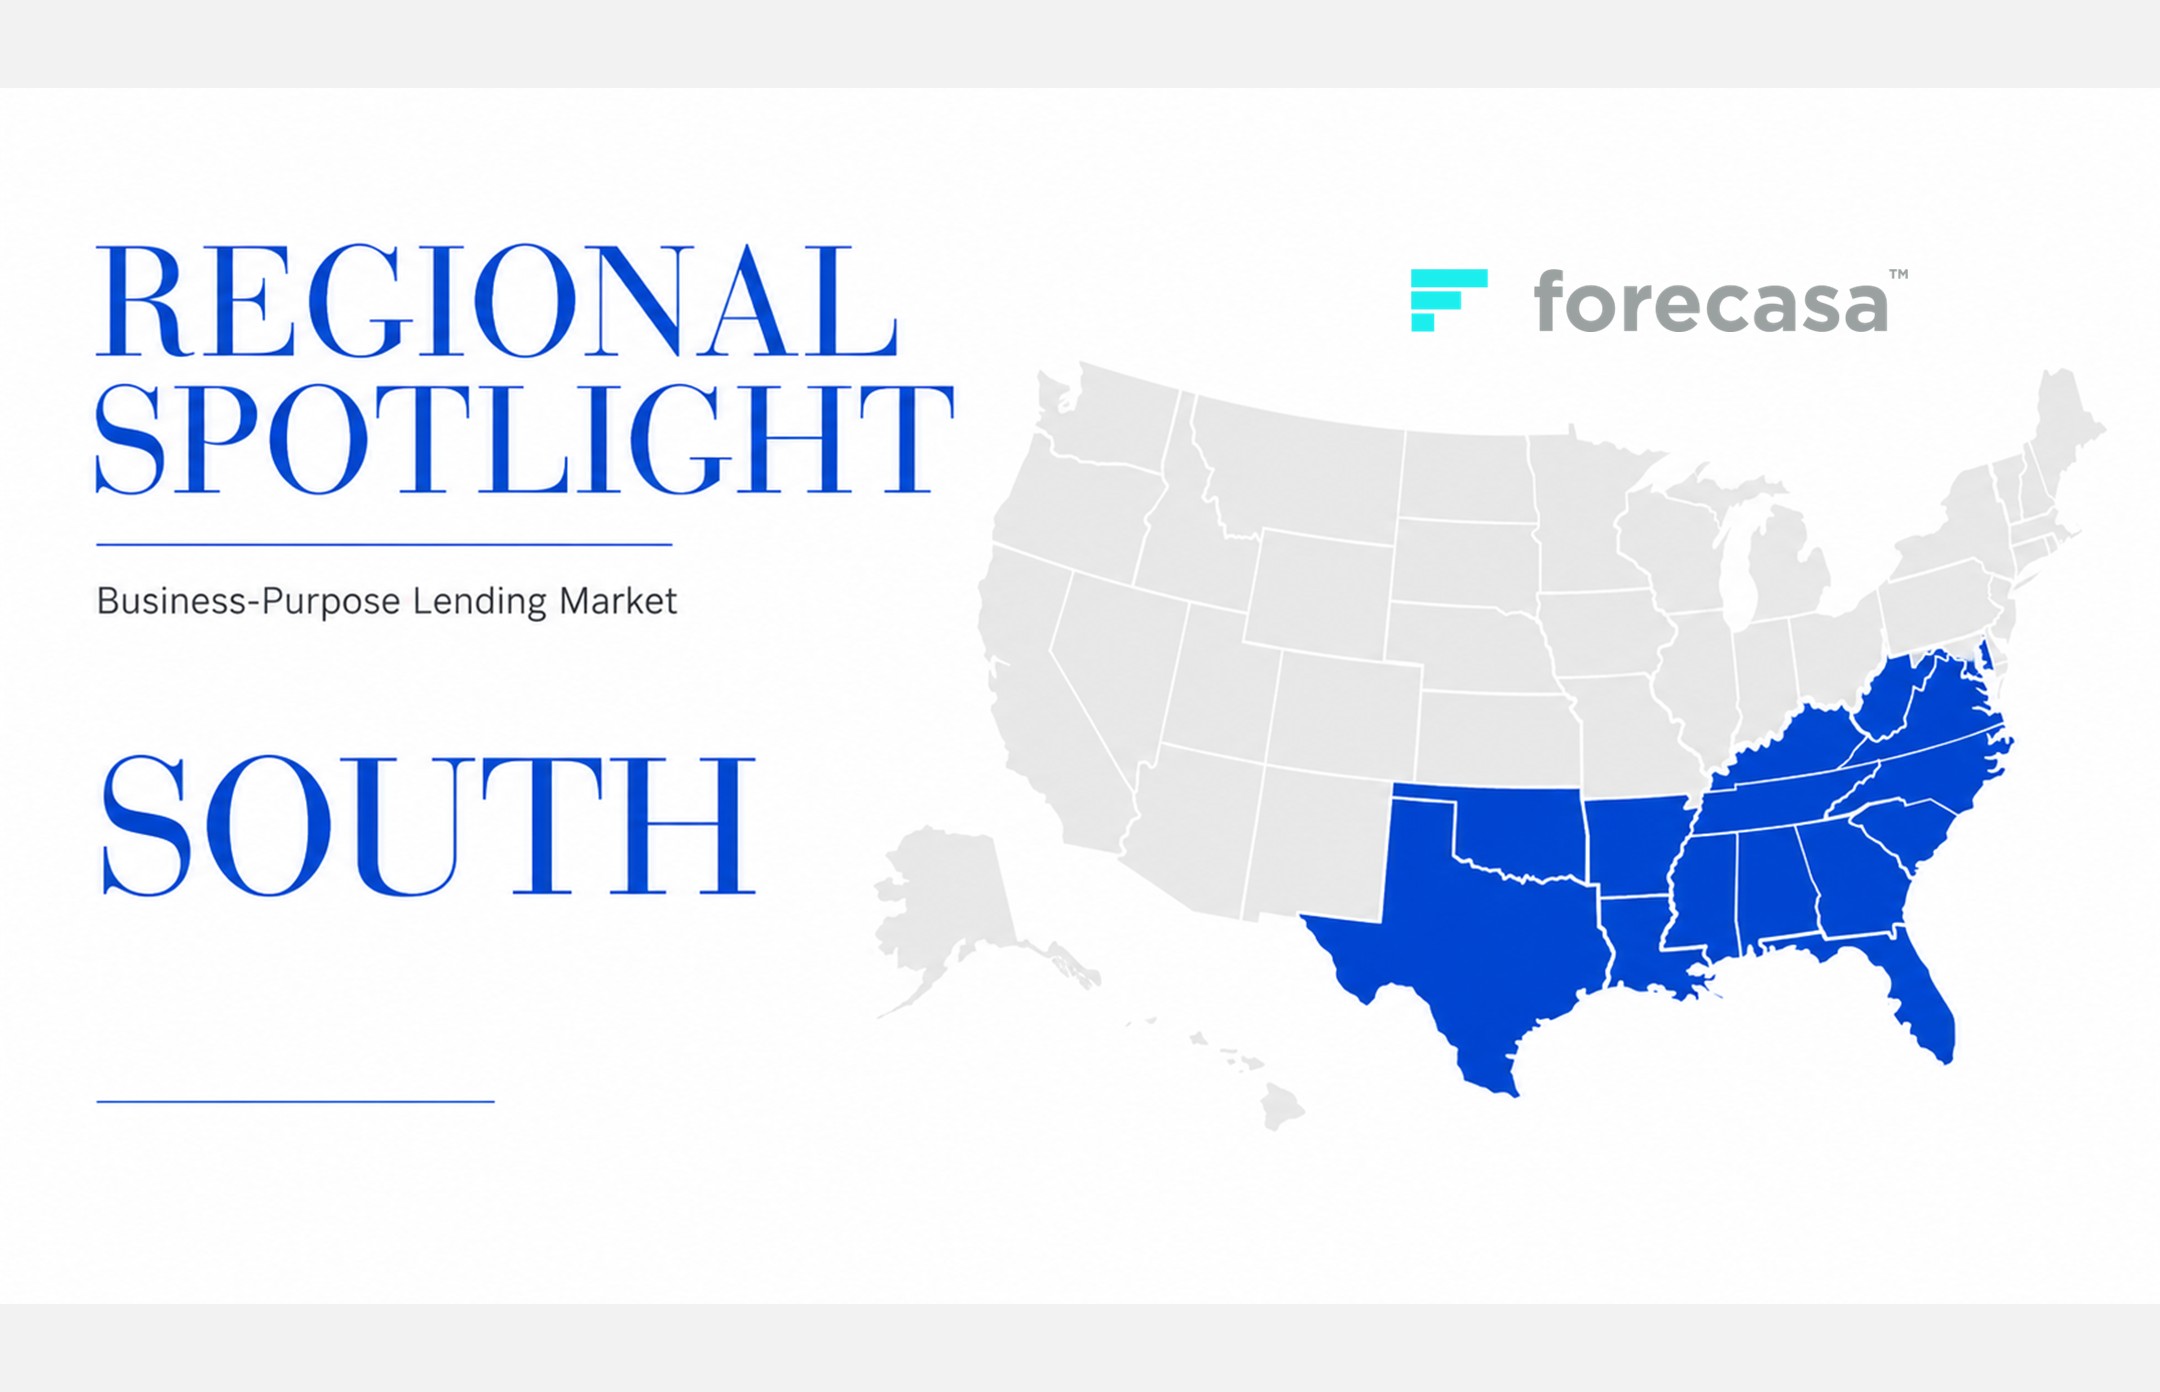
The US Census Bureau defines the South region into three parts: South Atlantic (DE, MD, DC, VA, WV, NC, SC, GA, FL), East South Central (KY, TN, MS, AL), and West South Central (AR, LA, OK, TX). Across the South, lending to real-estate investors has become one of the most dynamic corners of the mortgage market. There are hundreds of thousands of business-purpose loans originating in the South each year. We define the BPL market as all originations where the borrower is a business entity, and private lenders’ share of the South’s BPL market has grown over 40% since 2022. Within the South we show who is lending, where volume is growing, and where the emerging lenders are active. This is the first installment of Forecasa’s Regional Spotlight series where we highlight a particular region’s BPL lending market.
1. Who is lending: the BPL market by lender type
Conventional lenders originate roughly half of all Southern BPL loans by count, with private lenders a clear second at just over a quarter. Dollars, though, tell a different story: commercial lenders write under 2% of loans but nearly 20% of volume while private lending’s small-balance loans are 26% of loans yet only 8% of dollars.
Lender type | Loans | % of loans | $ volume (bn) | % of $ |
Conventional | 194,746 | 50.3% | 505.8 | 58.6% |
Private | 101,998 | 26.4% | 71.7 | 8.3% |
Non-QM | 15,817 | 4.1% | 5.3 | 0.6% |
Commercial | 7,473 | 1.9% | 170.4 | 19.8% |
Other / unclassified | 67,119 | 17.3% | 109.7 | 12.7% |
Trailing 12 months (June 1, 2025 – May 31, 2026). “Other/unclassified” is mostly lenders that never resolved to a named company, plus lenders typed outside the four buckets above.
2. Private lending in the spotlight
Private lending has been the South’s fastest-rising BPL segment: its share of loan count climbed from 19% in 2022 to 27% in 2025, and private originations grew even as the overall BPL market cooled from its early-decade peak. Measured in dollars the share is smaller, but it has still climbed more than 40% off its 2022 level, reaching nearly 9% in 2025.
Year | All BPL loans | Private Lending loans | Share by count | All BPL $ (bn) | Private $ (bn) | Share by $ |
2022 | 498,300 | 94,904 | 19.1% | 1,121.0 | 70.6 | 6.3% |
2023 | 383,148 | 84,151 | 22.0% | 727.5 | 54.0 | 7.4% |
2024 | 368,471 | 94,789 | 25.7% | 741.7 | 56.1 | 7.6% |
2025 | 381,756 | 103,256 | 27.1% | 828.9 | 73.9 | 8.9% |
2026* | 191,812 | 50,806 | 26.5% | 416.5 | 32.5 | 7.8% |
*2026 is a partial year and is not annualized.
3. Biggest movers by metro
Across the trailing year, BPL lending expanded in nearly every Southern metro. This was a rising-tide market, not a reshuffling one. Houston (+2,847 loans) and Miami (+2,594) led in absolute growth, with Tampa and Dallas–Fort Worth close behind; declines, where they occurred at all, were confined to a handful of small markets and never exceeded a few loans.
Metro (MSA) | Trailing yr | Prior yr | Change | % |
Houston, | 20,851 | 18,004 | +2,847 | +15.8% |
Miami–Ft. Lauderdale, FL | 18,395 | 15,801 | +2,594 | +16.4% |
Tampa, | 9,365 | 8,152 | +1,213 | +14.9% |
Dallas–Fort Worth, TX | 25,814 | 24,637 | +1,177 | +4.8% |
Memphis, | 6,176 | 5,528 | +648 | +11.7% |
Austin, TX | 6,171 | 5,571 | +600 | +10.8% |
Louisville, | 4,722 | 4,123 | +599 | +14.5% |
Trailing 12 months (June 1, 2025 – May 31, 2026). vs. the prior 12 months (June 1, 2024 – May 31, 2025), by loan count.
4. Emerging lenders by metro
Forecasa identifies and tracks emerging lenders. This is any lender who made their first business-purpose loan origination within the last 12 months and has originated at least three business-purpose loans in that time. Of 1,227 emerging lenders nationwide, 647 originated at least one of those loans in the South. They clustered in the region’s largest metros, led by Miami, Dallas–Fort Worth, Atlanta, and Houston; note that a handful of new commercial entrants in Texas skew the dollar totals well above the higher-count Florida markets. The table below shows the ten metros with the most emerging lenders:
Metro (MSA) | Emerging lenders | Loans | $ volume (M) |
Miami–Ft. | 69 | 277 | 314.9 |
Dallas–Fort Worth, TX | 65 | 246 | 1,741.8 |
Atlanta, | 62 | 248 | 374.1 |
Houston, TX | 62 | 198 | 1,308.5 |
Tampa, | 39 | 162 | 286.0 |
Charlotte, NC-SC | 36 | 97 | 94.9 |
San | 32 | 79 | 386.1 |
Orlando, FL | 25 | 36 | 89.6 |
Baltimore, | 22 | 84 | 154.7 |
Nashville, TN | 21 | 84 | 158.6 |
Loans and dollar volume reflect what these emerging lenders originated within each metro during the trailing year (June 1, 2025 – May 31, 2026).
The BPL market in the South grew in nearly every major metro, and it pulled in more than half of the country’s emerging lenders along the way. As the Regional Spotlight series continues, we will uncover whether other regions behave the same way.
Interested in deeper market intelligence?
Forecasa provides proprietary data, AI-powered analytics, and customized insights on the U.S. business-purpose lending market. To learn how Forecasa can support your business, contact us.